


News
The main export commodities during the early 9 months of 2013
Update: 11/13/2018
.jpg)
According to statistics of the General Administration of Customs , from January to the end of September 2013 , the total value of import and export goods of Vietnam reached U.S. $ 192.53 billion , up 15.3 % compared to the same period in before , of which exports reached 96.27 billion U.S. dollars , up 15.5 % and imports 96.26 billion U.S. dollars , up 15.1 % .
As a result, the balance of trade in goods balance Vietnam's pretty early in the third quarter of 2013. The major export commodities include :
Telephones and accessories : Export of this group in the month 9-2013 reached U.S. $ 2.13 billion , up 15.6 % from the previous month , the export value of this group of 9 thang/2013 15 , 52 billion U.S. dollars , up 79.8 % ( equivalent to U.S. $ 6.89 billion ) compared with the same period in 2012 .
European Union ( EU ) is the largest import partner group Electrical goods , mobile phones and accessories from Vietnam origin with a value close to 6.15 billion U.S. dollars, up 65.4 % and 39.6 % total value of exports of this group in the country .
This is followed by the market : The United Arab unity : 2.63 billion dollars , more than 2.5 times India 739 million, nearly 2.5 times Hong Kong $ 633 million , an increase of 65 , 4 %, Russia 597 million, up 14.8 % ... compared with the same period in 2012 .
Computers , electronic products and components : exports of this group in months is nearly $ 930 million , down 6.8 % from the previous month , bringing the total export value of this group in the May 9, 2013 to 7 , $ 7 billion , up 43.9 % ( equivalent to U.S. $ 2.35 billion ) compared with the same period in 2012 .
The main import markets computers, electronic products and components from Vietnam in 9 thang/2013 including EU market 1.71 billion, up 76.1 %, China 1.63 billion , an increase of 27.2 % ; 956 million U.S. dollars , up 51.4 %, Malaysia 882 million, up 48 % ... compared to the same period last year .
Textiles : textile group exports during the month 9-2013 reached $ 1.66 billion , down 7.8 % from the previous month , thereby enhancing the value of this commodity group exports in May 9, 2013 to 13 , 08 billion U.S. dollars , up 17.3 % compared to the same period in 2012 . Of which: exports of textiles and garments to the U.S. market reached $ 6.4 billion , an increase of 14 % to the EU reached $ 1.98 billion, up 9.2 % to Japan reached U.S. $ 1.74 billion , up 20.1 % ...
Footwear : exports in September reached 549 million, down 25.1 % compared to August . As of September 2013 , exports of footwear group reached more than 6 billion U.S. dollars, up 15.1 % compared to the same period in 2012 . In particular , exports to the EU market was $ 2.05 billion , up 10 % and accounted for 34.1 % of export turnover of this group in the country . Next is exported to the U.S. market reached U.S. $ 1.93 billion , up 17 % to Japan reached 291 million, up 17.3 % ... compared with the same period in 2012 .
Crude Oil : Crude oil exports in January was 505 thousand tons , down 29.6 % compared to the month 8-2013 is worth 463 million, down 27.9 % . As of May 9-2013 , crude oil exports of the country was 6.2 million tons , down 11.1 % , turnover reached 5.35 billion U.S. dollars , down 14.1 % compared to the same period last year .
Vietnam 's crude oil is exported mainly to Japan : 1.77 million tons , down 15.4 % to 1.29 million tonnes of Australia , increased by 4 % to Malaysia 900 thousand tons, up 11.1 % ; South Korea to 626 thousand tons , an increase of 4.1 % over the same period nam2012 .
Machinery , equipment , tools and other accessories : 9-2013 During the month , exports reached 505 million U.S. dollars , down 6.2 % , thereby bringing the total value of export commodities in the May 9, 2013 to close 4.37 billion, up 5.1 % compared to the same period in 2012 .
As of May 9-2013 , commodities exported to the Japanese market is 881 million, down 3.3 % to U.S. $ 723 million , down 2.6 % to EU 522 million, up 2 , 7 % to the Hong Kong market 262 million, up 13.8 %, to China 259 million, up 2 % ... compared to the same period last year .
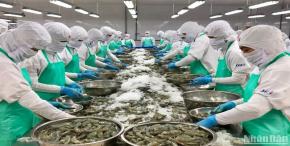
Seafood : Seafood exports of Vietnam in September reached 641 million, down 2.9 % from the previous month , thereby increasing the total exports in 9 months to 4.68 billion U.S. dollars , up 4.7 % compared to the same period in 2012 .
9 months 2013, seafood exports of Vietnam mainly to the following markets : United States of more than $ 1 billion , tang15 % compared to the same period last year, EU : 816 million, down 3.4 % ; Japan : 788 million, a slight increase of 0.5 %, South Korea : 327 million, down 10.8 % ...
Wood and wood products : exports in September reached 451 million, down 5.2 % from the previous month , bringing the total export value in May 9, 2013 to 3.87 billion U.S. dollars , up 14.9 % compared with the same period in 2012 .
9 months 2013, the group of wood and wood products exported to the United States reached $ 1.4 billion , up 8.6 %, to 716 million in China , up 31.3 % to 579 million Japanese , increased 19.9 % to EU 427 million, down 4 % ... compared to the same period in 2012 .
Rubber : May 9-2013 , rubber export volume was nearly 118 thousand tons , valued at $ 265 million , up 10.4 % in volume vatang 14.5 % in value compared to the previous month . As of May 9-2013 , total export items of the country are more than 726 thousand tons , up slightly 1.1 %, worth $ 1.72 billion, down 15.8 % compared to the same period in in 2012 .
China was the main import partners of Vietnam Rubber in 9 months with almost 325 thousand tons , down 7.6 % and accounted for 44.7 % of exports of rubber in the country. Followed by Malaysia : Close to 156 thousand tons , up 14.2 % compared to the same period in 2012 ...
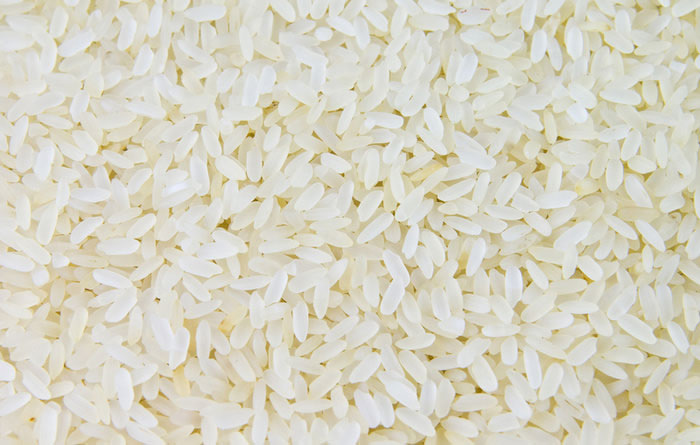
Rice : In the month 9-2013 , the country exported nearly 461 tons , decreased by 30.1 % , valued at more than $ 206 million , down 28.4 % from the previous month . As of May 9, 2013 , the export of this group is 5.32 million tons , down 14.7 % and the value of $ 2.34 billion, down 17.2 % compared to the same period last year .
In the third quarter of 2013 , Vietnam exported rice mainly to markets : China 1.76 million tons , up 2.7 %, Cote d'Ivoire 462 thousand tons , a slight decrease of 0.5 % Philippines 353 thousand tons , down 66 %, Malaysia : 348 thousand tons , down 36.3 % ; Ghana nearly 300 thousand tons , up 14.1 % ... compared to the same period in 2012 .
Cashew nuts : In the month 9-2013 , the country exported 23.4 thousand tons of cashew nuts worth $ 144 million, down 20.6 % in volume and 25.1 % in value compared to the previous month . As of May 9, 2013 , the export of this commodity is near 190nghin tons , up 17.3 % and valued at $ 1.2 billion , up 9.9 % compared to the same period last year .
United States and China are the two main partners cashews imported from Vietnam to import in the past 9 months respectively 60.7 thousand tons , an increase of 34 % and 35.4 thousand tons , an increase of 15.9 % . Thus, the total Vietnam cashew exports in two markets accounted for 50.7 % of the country's exports during this period .
Coal : In the month 9-2013 , coal export volume is 804 thousand tons , up 108.8 % , is worth $ 59 million , an increase of 94.4 % compared to August . Thus, the 9-month 2013, total coal exports of the country 's 9 million tons , down 12.2 % , but the average export unit price decreased 17 % to exports of this group reached 651 million, decreased 26.7 % compared to the same period in 2012 .
China continues to be the largest import partner of Vietnam coal with 6.85 million tons , down by 12.4 % and accounted for 76 % of total export commodity of the country . Following the Japanese market is 872 thousand tons , up 4.8 % and South Korea 791 thousand tons , down 15.4 % ...
Source: http://www.baohaiquan.vn
Other news